Once your project is built, you might want some way to monitor the temperatures of the various components. This is a basic data logging system we built for this project; it consisted of
- some OneWire temperature sensors
- an Arduino -- to interface with the temperature sensors and feed the data tothe SensorClient when asked
- a .NET application -- polled the Arduino and loaded any data from it into the MySQL db
- Mono -- to run the .NET app on an Ubuntu server
- a MySQL database
- an Apache2 websever -- to run the data-graphing aspx
The .NET app and the data-graphing aspx file were generously designed and created for this project by Sage Hobbs, owner of Eclipsa.net.
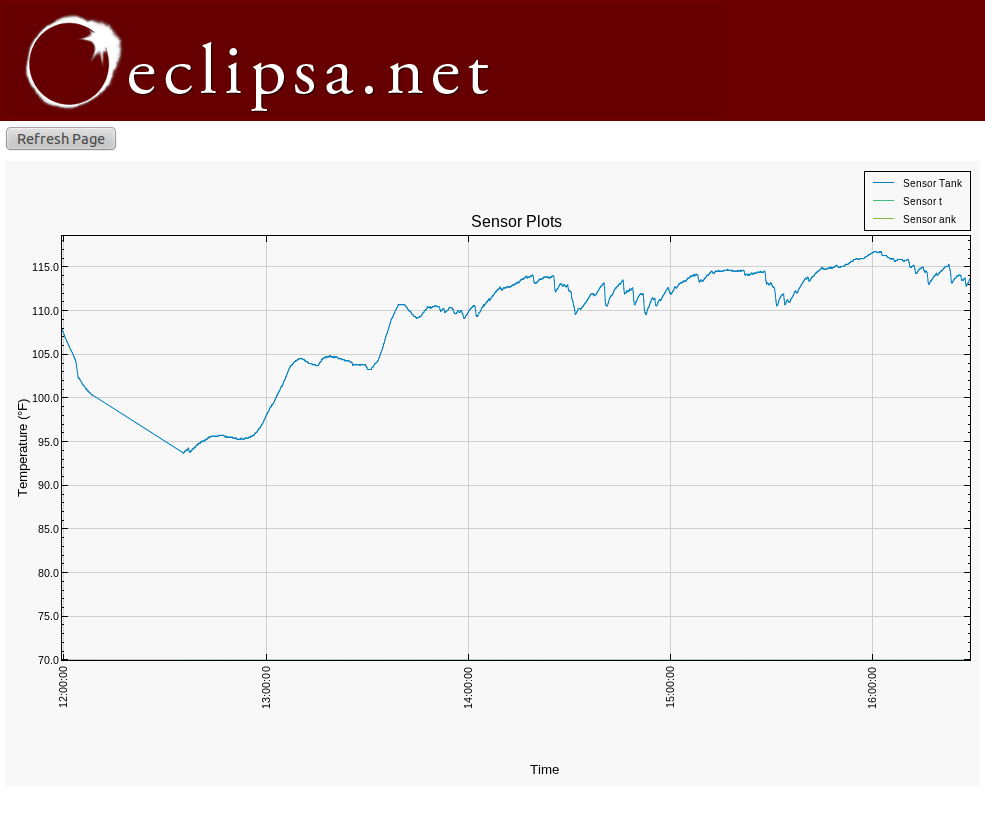
Here's a screenshot of data from the last day of the KC Maker Faire (June 26th, 2011). There's only one dataline in this graph; originally, there were 4. The tape in the reservoir holding up the water protection for one of the OneWires failed, causing it to short out. I hastily changed the sensors around and tweaked the Arduino code to only show the remaining sensor.
Additionally, here are images of the .NET SensorClient application and arduino code, as well as the the data-graphing .aspx in situ.